Our carbon footprint
The carbon footprint of our kiwifruit
Zespri is committed to understanding the impact of the supply chain on climate change and what it can do to minimise this. In 2019, we assessed the footprint of Zespri Kiwifruit produced in New Zealand and consumed globally for the 2017 season. This was estimated to be 2kgs of CO2 -e per kilogram of fruit consumed. This is just over 20 percent lower than for the 2009 crop. This resulted from a more efficient production and supply chain in the 2017 season, despite the increase in the crop between 2009 and 2017. These efficiencies also meant the total emissions for 2017 remained in line with those of 2009 at just over 600,000 tonnes CO2 -e.(Figure 1).
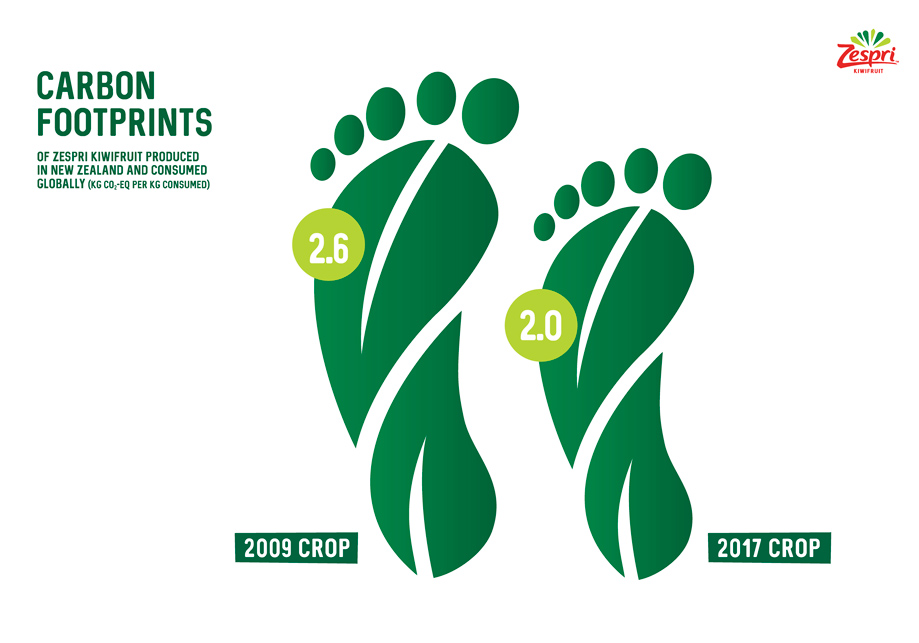
Figure 1. Carbon footprints (kg CO2-eq per kg consumed) of Zespri kiwifruit produced
in New Zealand and consumed globally.
The carbon impact of each stage in the supply chain is shown in Figure 2 with shipping being the largest part. The next largest component was consumer emissions, which are those associated with transport to and from the retailer and fruit waste (including the skin). This helps us understand how we can reduce emissions.
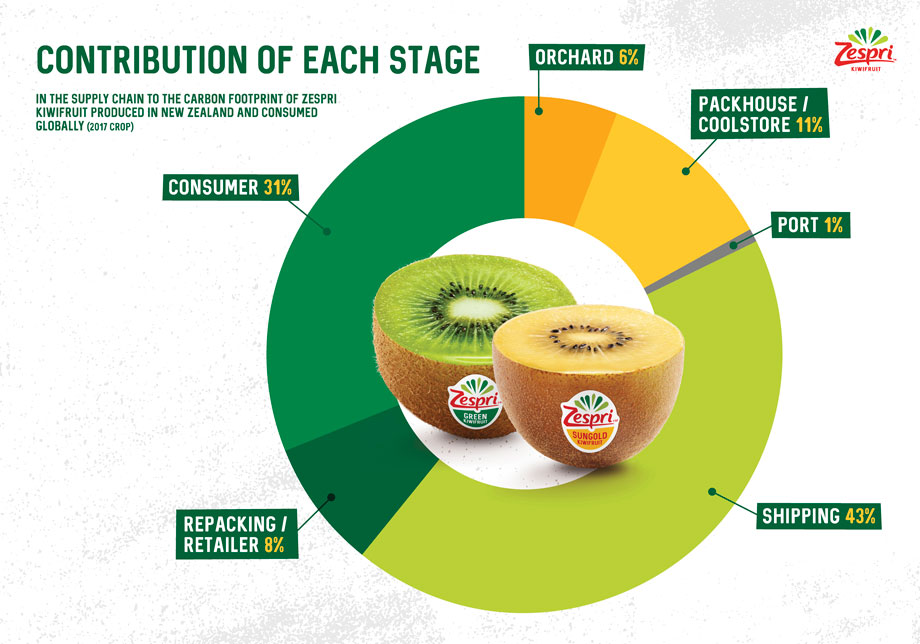
Figure 2. Contribution of each stage in the supply chain to the carbon footprint of Zespri kiwifruit produced in New Zealand and consumed globally.
Compared to many other common food products, the carbon footprint of Zespri’s New Zealand supply of kiwifruit is relatively low even though it is cool-stored for long periods and shipped all over the world (see Figure 3).
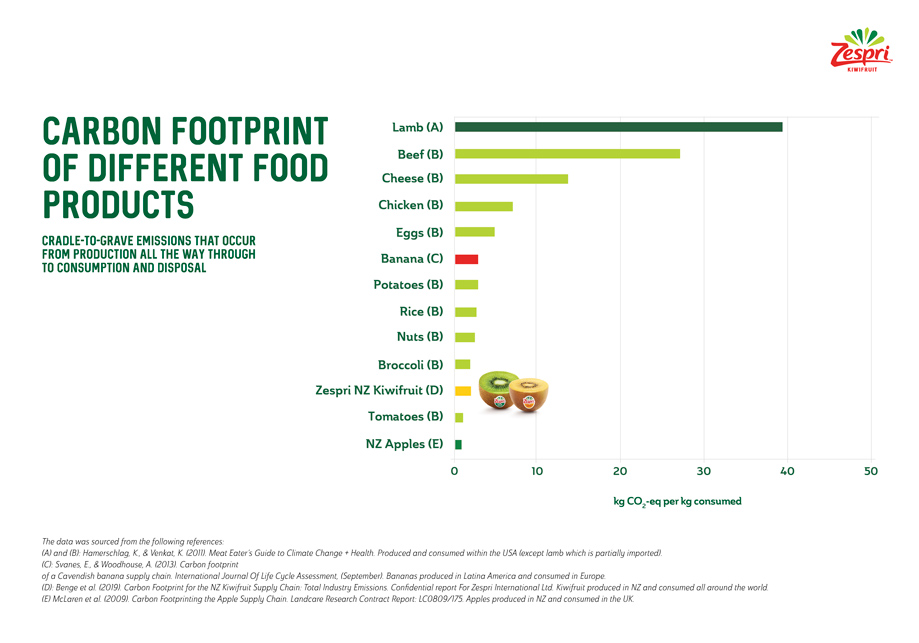
Figure 3. Carbon footprint of different food products. Cradle-to-grave emissions that occur from production all the way through to consumption and disposal.